Platform features
Partnerships and integrations
Platform overview
How the Viedoc platform works, what's included, licensing, and more.
Demo center
On-demand video demos, tutorials, and release highlights.
View all interfaces
The complete Viedoc product suite for clinical trials.
Services
Customer types
Use cases
Services overview
How Viedoc services work, what's included, licensing, and support options.
Become a CRO partner
Partnership benefits, resources, and growth opportunities for CROs.
Learn
About Viedoc
Sonex Health achieves 98% study-visit compliance with Mural Health * Viedoc ePRO
Medical device innovator Sonex Health elevated its post-market clinical research platforms and achieved high quality clinical data to support its regulatory and market access strategies.
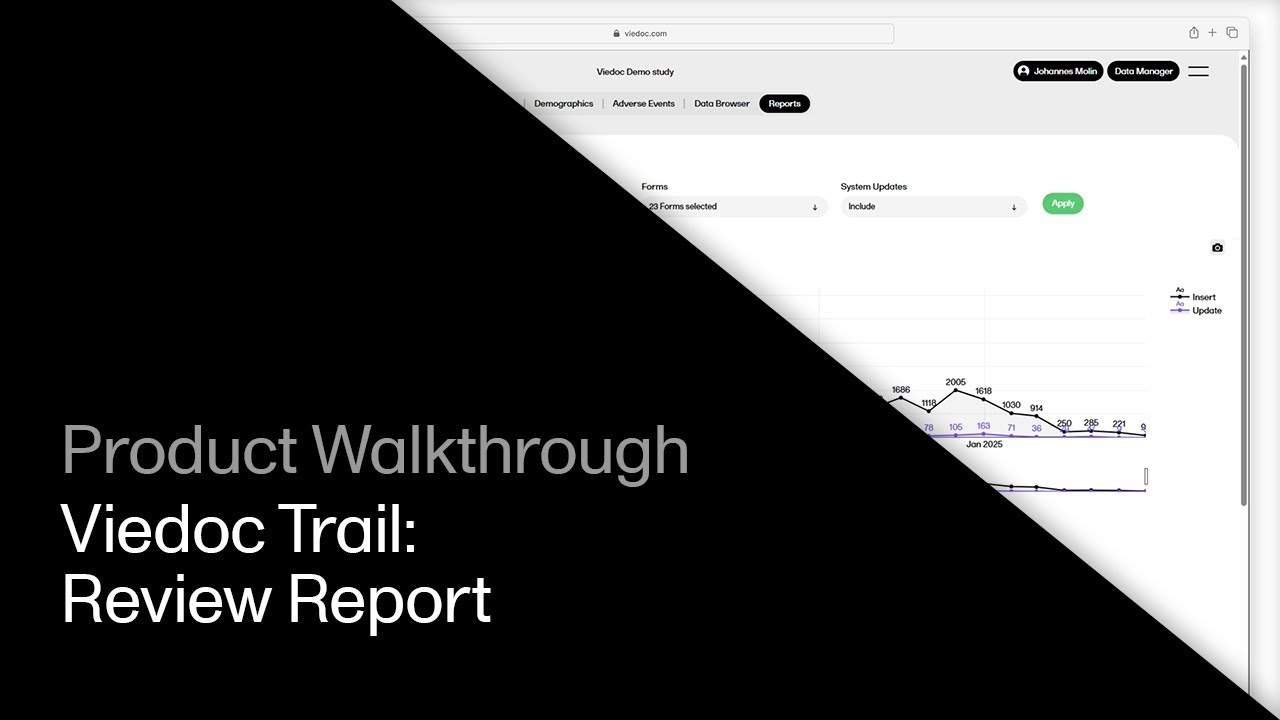
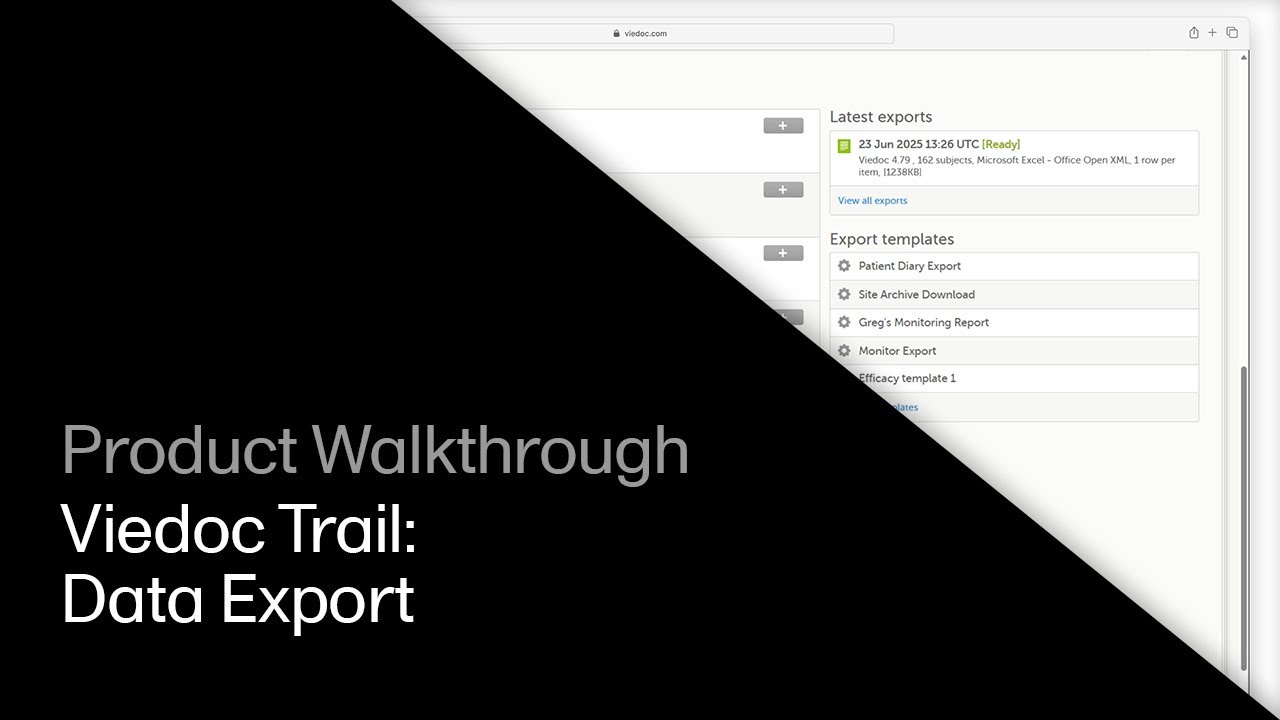
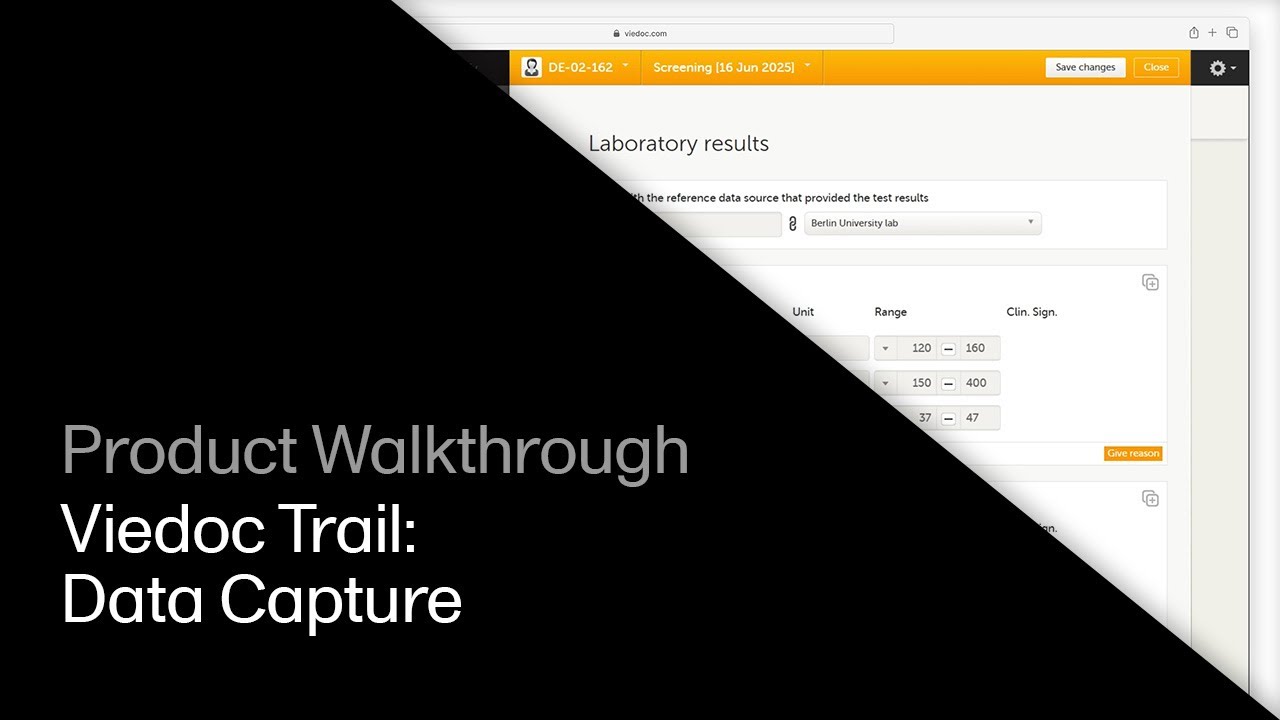
Explore the visualization tools and data browser for interactive study data analysis in Viedoc Reports.
Watch related demos to learn more about Viedoc eClinical suite.
Audit trail
Meet with us to see how you could apply Viedoc to your next clinical trial.